Step 2 - header map
Click here to download the complete files for all steps in this tutorial.
It would be good to see the locations of the 20 top customers on a map in the report. In the report script editor, under the report content data tab, press the add table to report button which has this icon:

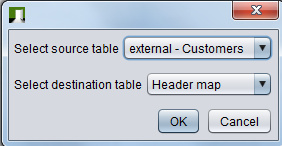
A dialog will appear asking you to select source and destination tables. Select the Customers table as the source and Header map as the destination, like this screenshot:
Press OK and a new tab will appear with the title Header map, containing a new data adapter table. Here you can configure a map view in exactly the same way you configured the show map control, only this map will appear at the top of your report. Configure your Header map exactly as shown in the following screenshot:
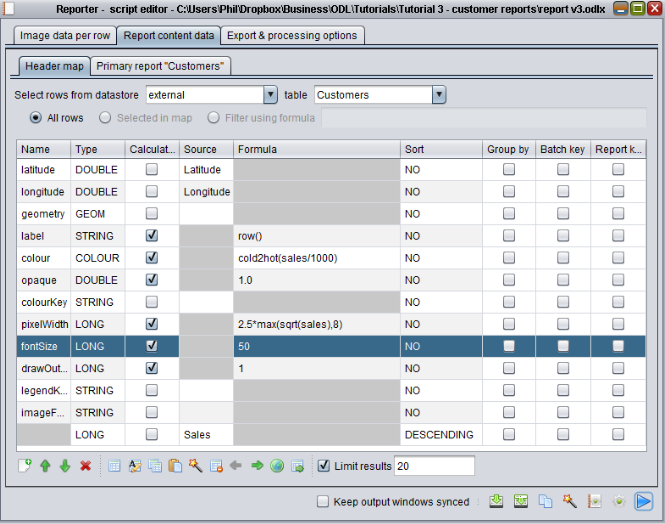
In this data adapter, we have done the following:
- Configured the record sorting and results limit to be exactly the same as the report text – so we see the same top 20 customers, sorted by sales.
- Coloured and set the size of the customers based on their sales, as in the earlier tutorial.
- Set the label column (which determines the text displayed in the map by the object) to the
row()function, which we also use to populate our rank column for the report's text.
Save the script and view the basic portrait report as per the previous tutorial step. You will see the report appear with a map at the top. The first time you run the script it can take a few seconds to appear, as it can be slow to generate the background header map image. This image is cached, so if you re-run the script, it will be faster the next time.
Press the save button at the top of the Jasper Reports control. In the save file dialog which appears, select the file type as pdf, select the directory to export to (e.g. Documents), enter a filename and then click the save button to export the report to pdf. Now open the report in an external pdf reader application (e.g. Adobe Acrobat reader) to view it. The following screenshot shows the report exported to a pdf:
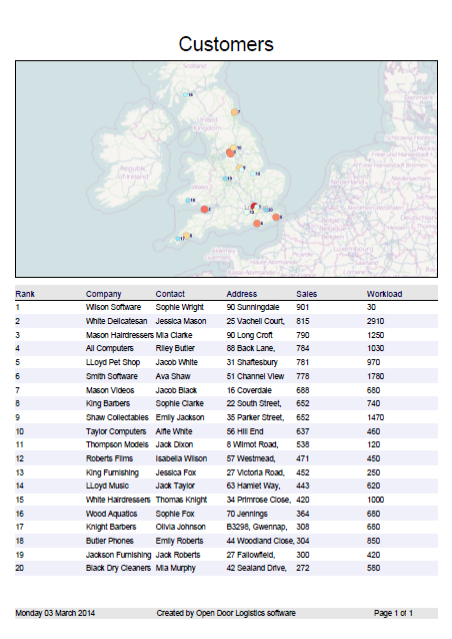 You will see that the quality of the header image is much better in the final pdf (and also when printed out) than shown in the Jasper Reports control within ODL Studio.