Introduction to ODL Studio
Open Door Logistics Studio is an easy-to-use Excel-compatible application that lets you perform geographic analysis and free sales territory design / sales territory mapping for your customer base. Using the studio you can query your data, generate maps of your customers, design sales or delivery territories based on demand, automatically optimise these territories and generate PDF reports. All your data is saved in an Excel spreadsheet and can be edited in both ODL Studio and Excel, allowing you to work with both applications interchangeably and seamlessly.
ODL Studio is open source and free. Anyone can use it or modify it. Go to our downloads page to download it.
Purpose of the tutorials
These tutorials detail how to configure ODL Studio for a typical set of requirements and save this configuration in ODL script files. The aim is for you to understand them and adapt them to your own requirements. Configuring ODL Studio is however a relatively complex task and these tutorials assume a reasonable proficiency in IT and system configuration. It is recommended that configuring ODL Studio to your own requirements is done either by your IT support staff or alternatively you could hire us to configure it for you.
Luckily configuring ODL Studio is once-only task; using the studio on a day-to-day basis is far simpler as you only need to run the pre-configured scripts. If you’re happy using Excel then you should find using the studio - once it’s configured - to be easy.
Key concepts
ODL Studio has five key concepts:
- Table format Excel spreadsheet
- ODL components which perform geocoding, drawing maps, automated planning and reporting.
- Data adapters which adapt your spreadsheet's data to the format expected by components.
- Formulae which are used within data adapters.
- ODL scripts which save the configuration of the components and adapters.
We examine these concepts in greater detail in the following sections.
Table format Excel
A ‘table format’ Excel is just an Excel spreadsheet formatted according to certain rules:
- Each and every sheet holds a single table of data.
- The first row of the Excel sheet contains the names of each column.
- The data starts at the second row and cannot contain gaps (i.e. an empty row or column).
- No data is allowed outside of the table.
Any spreadsheet used by ODL must follow the rules. The following screenshots show examples of correct and incorrect formatting:
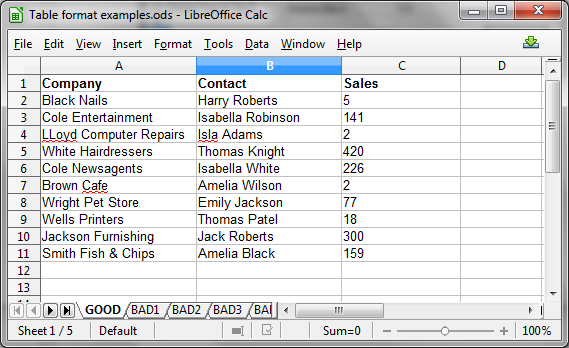
Example 1 – The table has the correct format as all data is contained within the square defined by the header row. (Libreoffice Calc is used to display the table in the screenshot).
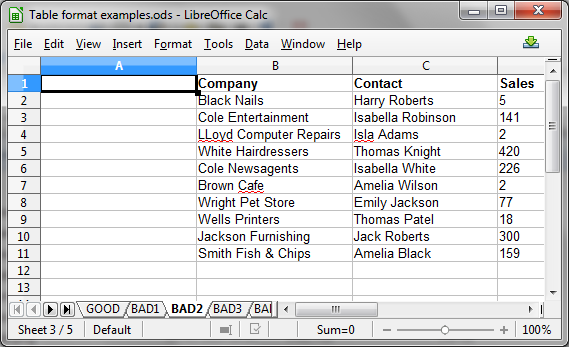
Example 2 – The table’s format is incorrect as the first column is empty.
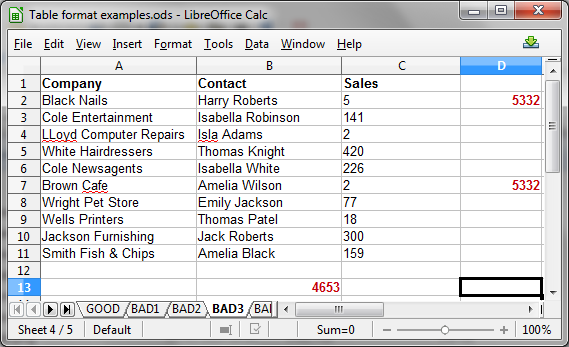
Example 3 – The table’s format is incorrect as the red data is outside of the square.
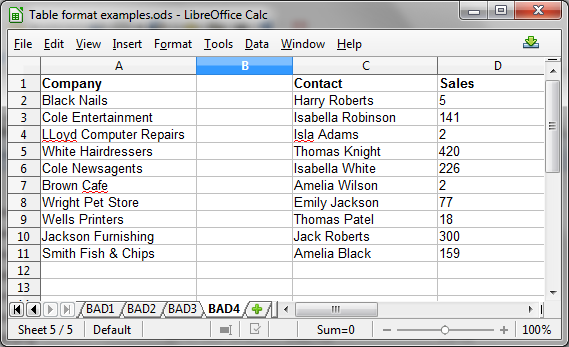
Example 4 – The table’s format is incorrect as the second column is empty.
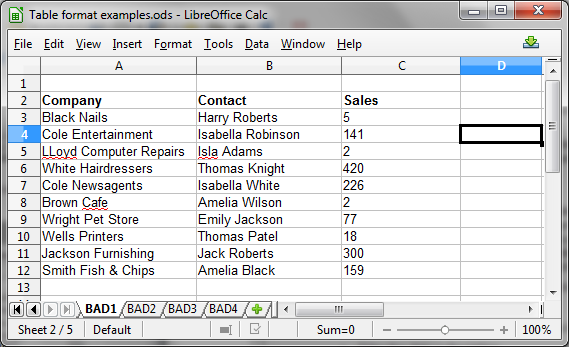
Example 5 – The table’s format is incorrect as the first row is empty.
ODL Studio can load, save and edit Excel spreadsheets in this table format. Users would therefore normally do initial preparation of their data within Excel or Libreoffice/ OpenOffice calc and then open the same file in ODL studio to perform geographic and territory analysis.
Warning – some data created within Excel in your spreadsheet will not be retained. Excel formulae and Excel formatting in a spreadsheet are not preserved for any spreadsheet saved in ODL Studio. You are therefore advised to avoid using Excel formulae or Excel formatting within the spreadsheet. ODL Studio works with ‘raw’ Excel data - i.e. numbers and text only.
ODL components
Components in ODL Studio provide all the important functionality – e.g. geocoding, mapping, reporting etc. Loosely speaking, a component is a module which reads and writes to a set of input tables and may also output tables. For example:
- A geocoding component takes a table with columns address, latitude and longitude. It then uses the data in the address column to fill in the latitude and longitude columns.
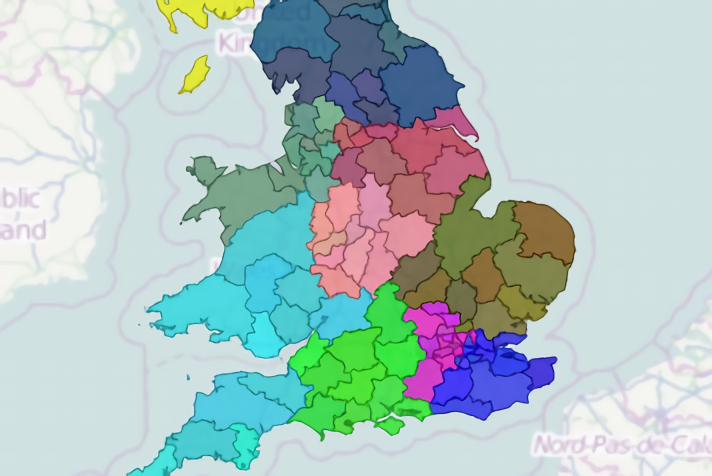
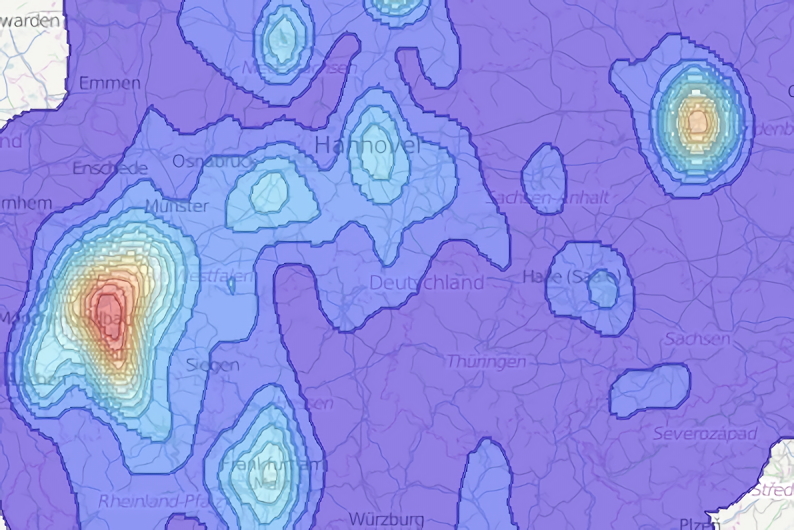
- The map drawing component takes a table with (a) latitude and longitude columns and uses these to display points on the map or (b) a well-known text geometry field and uses this to draw polygons - for example to draw sales territory maps.
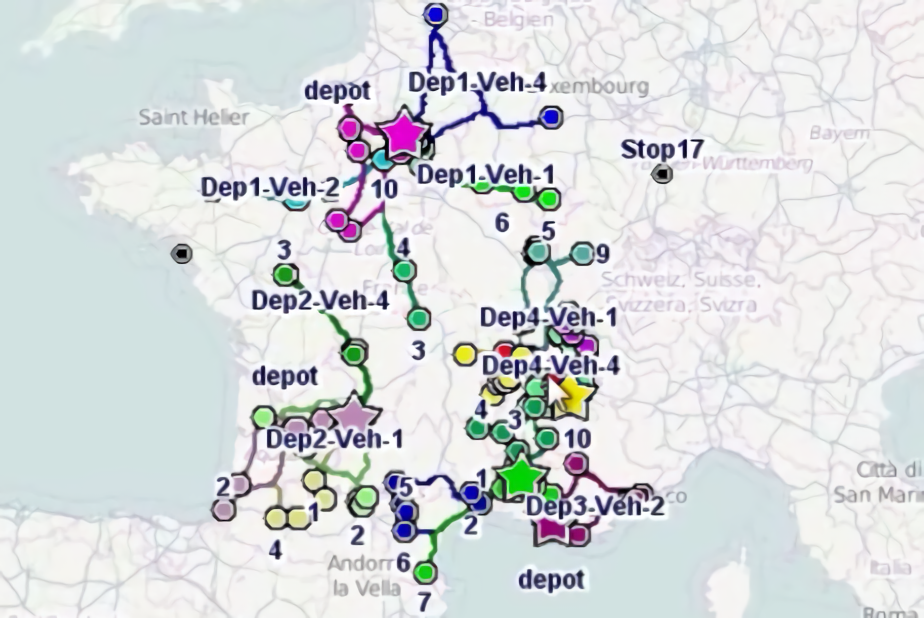
- The capacitated cluster component takes a table with input latitude and longitude columns, together with a demand column. It uses this data to allocate the input objects into clusters not exceeding a total demand - for example to perform automatic sales territory design.
- The reporter component takes multiple input tables - including tables defining how to draw a map - and generates pdf reports. You can use it to generate pdf reports containing sales territory maps.
Data adapters
Different components require different input data. If you already have a spreadsheet containing your customers or other data, this is unlikely to be in the exact format expected by every component you will use. Data adapters allow you to adapt the tables in your spreadsheet to the data format expected by a component. In other words, you are creating a view of your data for the component. Data adapters offer functionality similar to SQL queries and views. Using data adapters you can:
- Change the name or type of a column to another (e.g. your spreadsheet could have a column named sales but using the data adapter you could create a view of the data where this column is instead named demand).
- Re-order or remove columns.
- Calculate new columns using formulae based on the existing column values.
- Filter the input data.
- Perform group-by queries (for example, summing demand in each territory).
- Combine several tables together into one table (similar to an SQL union).
- Lookup a value from one table based on a value in another.
- Sort the data.
Formulae
Formulae are similar to the formulae you might use in Excel (and in some cases share the same name). When a data adapter is adapting one table (the source table) into the table required by a component (the destination table), rather than directly copying a column’s value across you can instead calculate the destination column using a formula. Formulae allow you to perform mathematical and string operations. Examples of these might be:
- The source table has two numeric columns called Sales1 and Sales2. In the adapted table you define a TotalSales column and set its value to the formula Sales1 + Sales2.
- The source table contains a string field name and you want to convert its value to upper case so you use the formula upper(name).
- Extract a postcode from a UK address - e.g. extract RM9 6ED from 27 Urswick Road, Goresbrook, London, RM9 6ED.
Formulae can operate on many different types of values including floating-point numbers, integer numbers, strings and even geometry, colours and images. A list of all formula supported in ODL Studio is available within the application, under the Help menu.
ODL scripts
Once you have created an adapter to connect your spreadsheet data to the component, and configured the component itself, you can save this adapter and configuration in a script. A script is a small XML file which sits in a directory on your computer. Whenever you need to re-run the component, you just need to play the saved script again. Even if the data in your spreadsheet changes, or you create a new spreadsheet, but the sheet and column names stay the same, you can re-run components by simply replaying the scripts.
Tip – scripts let you do the complicated configuration once and once only.