Step 1 - text only report
Click here to download the complete files for all steps in this tutorial.
Unzip the tutorial files to a directory on your computer. Within ODL Studio, load the Excel spreadsheet input data.xlsx from the unzipped tutorial directory. This is the same spreadsheet as we used in Tutorial 1. Ensure the Customers table is selected in the tables list and then use the component wizard to launch the Reporter component script editor. The following dialog will appear:
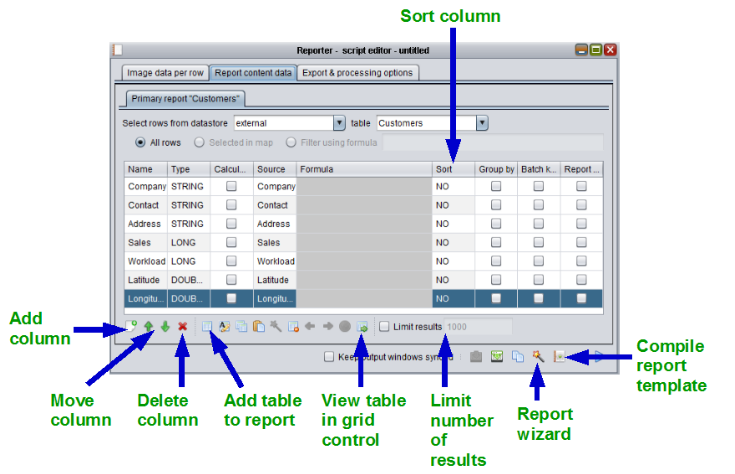
Select the report content data tab at the top of the dialog. This editor contains two important toolbars - (a) the data adapter’s toolbar directly below the data adapter table and (b) the script editor toolbar on the bottom right of the dialog. To build reports you will need to use various buttons on both these toolbars, as marked on the screenshot above. You are advised to familiarise yourself with the layout of these toolbars. Note that in versions of ODL Studio after 1.0.0, the functionality available under the report wizard button has been moved to a set of buttons under the Export and Processing tab.
All customers report
The adapter has been automatically filled with all columns from the Customers table. Do the following steps:
- We do not want to include the latitude and longitude columns in the report so:
- Select these fields (one at a time) in the data adapter grid by clicking on them. When you select a destination field the entire row in the data adapter grid is highlighted in blue.
- For each press the delete field button (the red cross beneath the data adapter grid, as shown in the above screenshot).
- View the basic report:
- For ODL Studio version 1.0.0, press the report wizard button (the wand icon on the bottom right of the script, see previous screenshot) and select the option view basic report (portrait) in the report wizard pop-up menu.
- For later versions, select the Export and Processing options tab and press the View basic portrait report button, in the group of tools buttons at the bottom of the tab page.
A window should appear containing the basic report, as shown in the following screenshot:
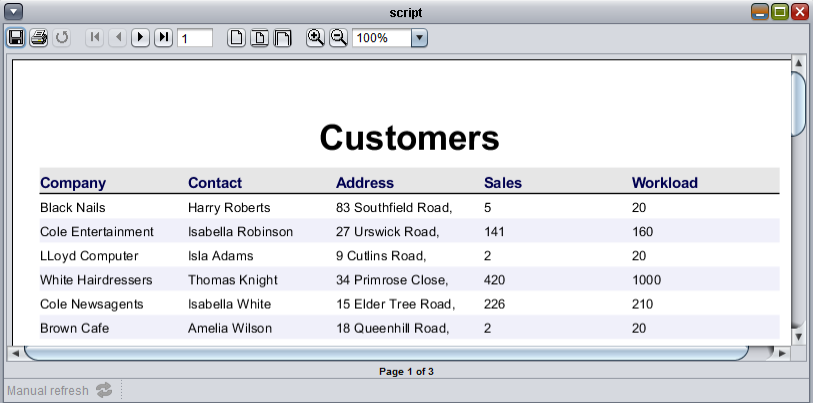
This is JasperSoft’s report viewer control. You can export the report to pdf, word etc. from here by pressing the save button on the top left of the control.
Save your script to the current scripts directory using the save as button on the bottom right of the script editor. It should then appear in the scripts directory panel. This tutorial has many steps and so you are advised to save your script often!
Tip – ODL Studio’s undo and redo functionality only works on the data in the spreadsheet – it does not work on script configurations.
Top customers report
We will now filter the report’s table to show only the top customers, by sales. We will also add a new column to show a customer’s rank. Do the following steps:
- Sort by sales
- Within the script editor, add a new field at the bottom of the data adapter table (see earlier screenshot which marks the add field button).
- Set its type to long (using the dropdown box available by clicking on its type).
- Set its source field to the Sales column.
- Under the Sort option select descending using the dropdown list. You are now sorting the report table by sales, largest first.
- Show only the top customers
- Tick the limit results checkbox directly below the data adapter table.
- Enter 20 as the number. You are now selecting only the top 20 results.
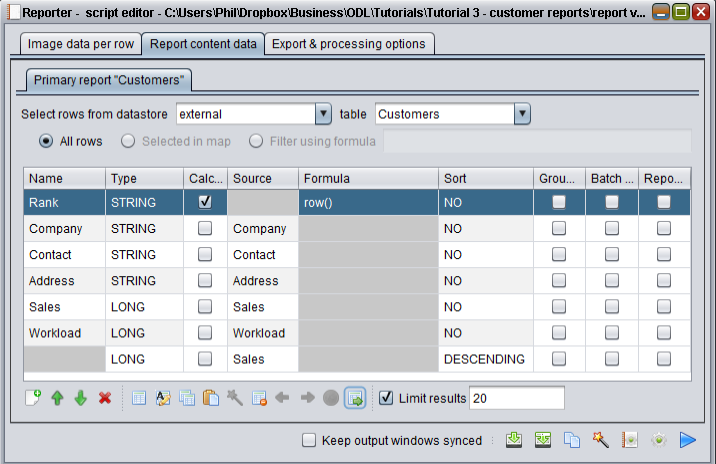
- Show customer rank
- Add a new column and change its name to Rank.
- Tick the Calculate checkbox to show this is a formula and enter
row()as the formula. - Move this row up to the top of the table using the green up arrow.
Your adapter should now be configured as per the following screenshot:
Save your script and test it by:
- ODL Studio version 1.0.0 - press the wizard button (the wand icon) and select view basic report (portrait).
- Later versions - under the Export and processing options tab, press the view basic portrait report button.
You should see a report containing only the top 20 customers, sorted by highest sales first.
Tip - you can also test the configuration of your data adapter by pressing the view table in grid control button shown in the earlier screenshot. It is usually quicker to show the data in the grid control instead of generating the report.