Tutorial V - vehicle routing & scheduling
ODL Studio uses the excellent jsprit vehicle routing library to provide vehicle routing & scheduling capabilities. Using the jsprit integration, you can plan a set of routes for your delivery fleet to efficiently serve a set of delivery points. You can then edit these routes using our drag-and-drop vehicle route editor, analyse them in various ways, inspect the routes in a map or export detailed reports to give to your drivers.
Walkthrough
This tutorial provides an introduction to the routing and scheduling capabilities available within ODL Studio. You are advised to work through the earlier tutorials before this tutorial. Firstly, watch the following tutorial video for an introduction to vehicle routing and scheduling using ODL Studio. Ensure you watch the video in high resolution, or some controls may not be clear.
Now, following the video step-by-step, do the following:
- Create demo data
- Open ODL Studio and create an empty spreadsheet using the new menu item.
- Create a new vehicle routing script with 1 quantity type and save it to your scripts directory.
- Under the Tools option in the new script, click on Create all input tables. This creates the tables Stops, VehicleTypes and Stops-order in your spreadsheet. Stops and VehicleTypes hold your input data and your output routes are held in Stops-order.
- Under the same option, click Demo - create stops and vehicles. This creates an artificial input dataset.
- Save your spreadsheet
- Run the optimiser
- Download the pre-built UK road network graph from our downloads page and unzip to a directory on your computer.
- Edit the vehicle routing script and under settings, change the script to use real road network distances, setting the directory to your unzipped directory. ODL Studio uses the excellent Graphhopper project for road network distance and time calculations. To find out how to build the file for other countries, see our advanced configuration tutorial.
- Click on the optimise icon under the script and wait for the optimisation to finish.
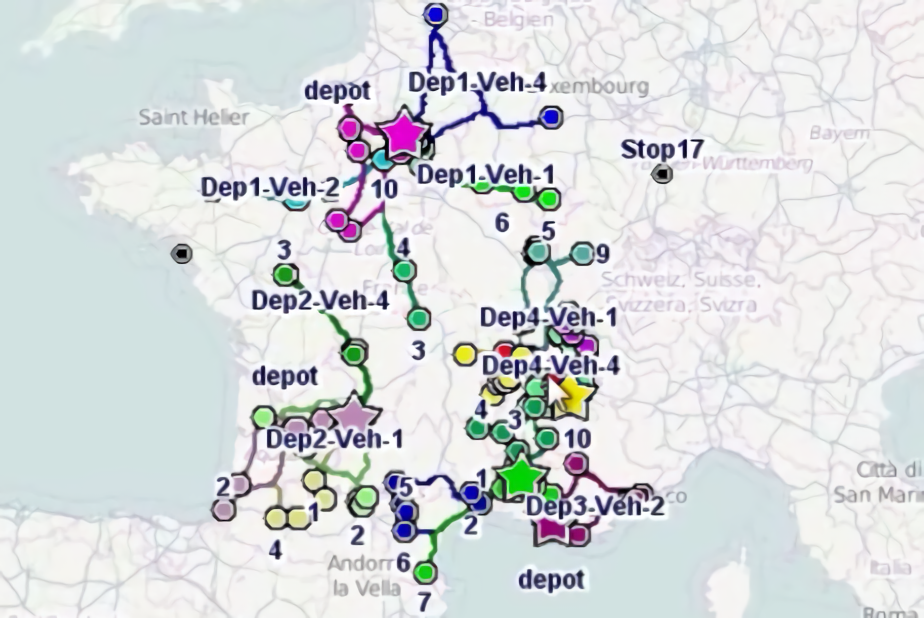
- Analyse the routes in the map
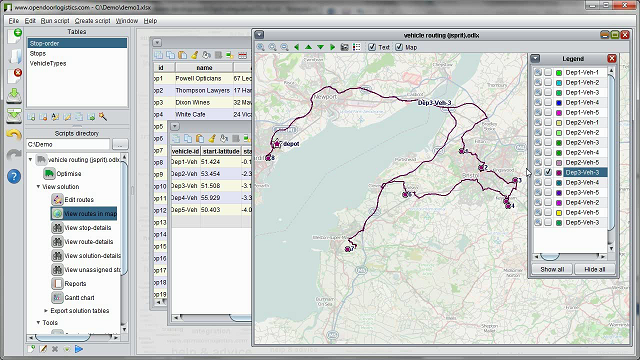
- Under the view solution option in the script, click on view routes in map.
- Navigate around the map to inspect the various routes.
- Use the legend control to zoom on and show / hide routes.
- Hover over the individual stops to bring up the tooltip with stop details.
- Activity breakdown with Gantt chart
- Click on the Gantt chart icon under the view solution option.
- Hover over different parts of the Gantt chart to view details on the activities.
- Editing vehicle routes
- Under view solution in the script, open the map by clicking on the view routes in map icon.
- Open the route editor by clicking on the Edit routes icon.
- As shown in the video, use the route editor control to drag stops off and between routes. You can also change the ordering of stops within a route by dragging them.
- Creating pdf reports of your routes
- Click on the reports icon under your script to generate a report.
- From the reporter viewer control, save the report to pdf (see example file here). If you want to automatically export the report to pdf or another format, or change the report format, see our tutorials on reporting or contact us for support and training. We can build custom route reports for you.
- Viewing and exporting route statistics
- Examine the various detail statistics tables.
- Export them to the spreadsheet using the Export solution tables option.
To use vehicle route planning in a production system, you need to populate your Excel spreadsheet automatically from your customer resource management or enterprise resource planning system. You may also wish to generate the vehicle routes and reports as part of an automated batch process using our ODL Connect product.
If you’d like to use travel times and distances from another map provider (e.g. Google or Navteq / HERE) then see the tutorial on using an external travel distances and times text file matrix.
Helpful tips on routing using ODL Studio
-
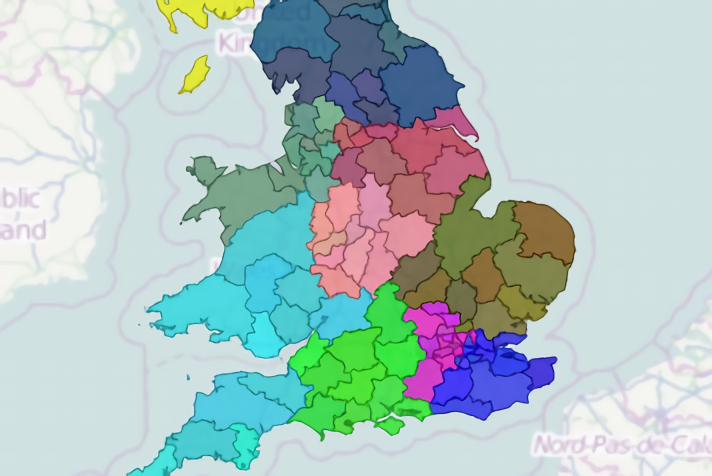
The route planning in ODL Studio works for everywhere in the world, though this is dependent on the quality of the OpenStreetMap road network data we use, which differs from country to country. (You can help improve OpenStreetMap yourself, if data accuracy is an issue, as it’s editable like Wikipedia). You’ll also need to have geocodes - latitudes and longitudes - of your stops.
-
You can use multiple quantity dimensions in your model (between 0 and 5), by selecting the number of quantity dimensions when you first create the vehicle routing script. Create the script by pressing the wizard icon on the left and select ‘Vehicle routing (JSPRIT)’. Quantities correspond to weight, volume etc. (for ODL Studio they’re just a number which gets summed up).
-
In the script, under ‘Tools, Demo - create stops and vehicles’, you can generate examples of different types of jobs. Options here include:
-
Include skills. A comma separated list of required skills is set in Stops.required-skills table (e.g. tail-lift, refridgerated) and the vehicle record in VehicleTypes.skills must have the same skills for the vehicle to serve the job.
-
Include unlinked pickups. Unlinked pickups are single-stop records which have a stop type P (P means pickup item and return it to the depot, which is the vehicle’s end location). The default stop type is D which means delivery from depot. In the script, under Settings, you can also check the option ‘Do all deliveries before all pickups’ and then save the script afterwards, and then when you optimise all stops with type D will be done on a route before the stops with type P.
-
Include linked pickup-delivery requests. These are point-to-point deliveries where the vehicle picks up an item from one location and delivers it to another location. These have 2 stop records with stop type LP and LD which have the same job-id field (so ODL Studio knows they’re in the same job).
-
-
In the script, under Settings, you can set the number of iterations, which determines how fast the optimiser runs for (save script after changing it). More iterations takes longer to run but will normally give you a better solution.
-
In the script, under Settings, Distances, you should set to use ROAD_NETWORK and set the location on your local disk of your road network graph. See tutorial here for details on how to build a road network graph. If your graph is in the wrong location, when you try to run the optimiser you will get an error complaining about a missing properties file. If your graph is large (e.g. North America) you will need to edit ‘Run ODL Studio 64-bit.bat’ and add java’s Xmx command to increase the memory available to ODL Studio, e.g. change the command to the following to let ODL Studio use up to 10GB:
start jre8_64-bit\bin\javaw.exe -Xmx10G -splash:splash.jpg -jar com.opendoorlogistics.studio.jar
- If your stops aren’t loading, try turning off constraints etc. one-by-one until you find what the problem is.
- Change distances back to GREAT_CIRCLE (in the script, under Settings, Distances) to use straight line distances. This will tell you if you have bad latitudes/longitudes or your road network graph doesn’t cover your stops.
- Leave start-time and end-time fields blank in the stops to remove time windows.
- Set stop quantity to zero to turn off quantity constraints.
- Make vehicle end-time later to give your vehicle more operating time.
- For problems where you need to refill / reload at depots, you can try linked pickup-delivery jobs. Linked pickup-delivery jobs involve moving something from one location (linked pickup stop) to another location (linked delivery stop). Both stops need the same job-id. In the demo data creator, tick the option to create some linked pickup-delivery to see their data format (look for the stops with stop type LP and LD and same job id). The pickup and delivery can have separate time windows (start-time and end-time). To reload at a depot, you would just set the linked pickup latitude and longitude to be your depot (vehicle start location), and then the vehicle should be able to go back to the depot to refill when needed. In your VehicleTypes table, you should also set a parking-cost, similar in value to the fixed-cost and much higher than the cost-per-hour, to discourage the vehicle going back to the depot too often. Note that in your routes, you may see the vehicle going back to the depot mid-route with deliveries still on-board, to be delivered late on in the route. It can do this if it doesn’t save you a depot visit or vehicle by doing the deliveries first. For these cases, you’d just ensure that in real-life the driver doesn’t pickup the deliveries until the depot visit before they deliver them.
Data format
ODL Studio uses an Excel as its input. The tables can be created if you use the ‘Tools, Create all input tables’ function in the vehicle routing script.
The Excel has the following two input tables containing your stop and vehicle data:
- Stop table fields:
- id - unique id of the stop.
- job-id - id of the job used for linked pickup deliveries.
- name and address - used for reporting only, not used by optimiser.
- latitude and longitude - stop location, should be in decimal degrees.
- sevice-duration, e.g. 00:09:00 for 9 minutes to serve the stop.
- start-time - earliest time the stop can be served (e.g. 08:30:00).
- end-time - latest time the vehicle is allowed to arrive at the stop.
- quantity (or quantity1, quantity2 etc if you set multiple quantity dimensions). Corresponds to weight, volume etc. Quantity on board the vehicle sums up for all on-board jobs and must be less than the vehicle’s corresponding capacity field.
- required-skills - comma separated skills the corresponding vehicle must have to be able to serve the job.
- VehicleTypes fields:
- vehicle-name - used for reporting only, not used by optimiser.
- vehicle-id - must be unique.
- start-latitude, start-longitude - start vehicle location (e.g. depot) in decimal degrees.
- end-latitude, end-longitude - end vehicle location in decimal degrees.
- start-time - time the vehicle starts working (e.g. 08:30:00).
- end-time - time the vehicle must return to the depot by (e.g. 18:00:00).
- capacity (or capacity1, capacity2 if you set multiple quantity dimensions). Corresponds to max weight, max volume etc.
- speed-multiplier - set to 1 by default, set to 0.5 if you want a vehicle to be twice as slow, 2 if you want a vehicle to be twice as fast.
- cost-per-km - cost incurred for each KM the vehicle drives (the optimiser works to reduce the total cost summed over all cost types and vehicles).
- cost-per-hour - cost incurred for each hour the vehicle drives.
- waiting-cost-per-hour - cost incurred for each hour the vehicle waits at a stop before the stop’s start-time.
- fixed-cost - cost of using the vehicle, independent of number of stops it does (i.e. cost is incurred if the vehicle does 1 or more stops, but not if it does 0 stops). Set this to high to minimise the number of vehicles used.
- parking-cost - cost for a vehicle visiting a new latitude and longitude. This can be used to encourage the optimiser to group together stops at the same latitude and longitude.
- skills - corresponds to required-skills in the Stops table.
- number-of-vehicles - how many instances you want of this vehicle.
ODL Studio stores the solution in the Stop-order table which has the following fields:
- vehicle-id
- stop-id
You can use the ‘View solution, Export solution tables, Export all’ command to export the following tables to your Excel:
-
Exported-Stop-Details. Gives ETAs etc. for each stop in the routes.
-
Exported-Route-Details. Gives an overview of each route (e.g. number of stops, total km).
-
Exported-Solution-Details. Gives an overview of the whole solution.
You can also view these tables using the script options ‘View solution, View stop-details’, ‘View solution, View route-details’. If you view these tables using the table viewer control, the tables will be updated when the solutions changes (e.g. if you drag and drop stops to different routes).