Contents
- Introduction
- Available script modes
- Input data
- Using Territorium with polygons
- Using Territorium with points
- Manually painting territories (polygons or points)
- Using the optimiser (polygons or points)
Introduction
Territorium is a module within ODL Studio that lets you easily manage territories based on customer points (latitude and longitudes) or polygons (e.g. postcode areas, zipcodes etc). It includes an optimiser module which can automatically assign territories based on min / max quantity etc. You can use Territorium in one of two modes - points or polygons.
Available script modes
If you start ODL Studio and use the wand icon in the toolbar below the tables panel (on the left) to select the “Territorium” component, a wizard will open which gives you the following options:
-
Create territories for customer points
-
Create territories for polygons in a shapefile
-
Create territories for customer points, with territory parameters in their own table
-
Create territories for polygons in a shapefile, with territory parameters in their own table
Firstly you should choose if you want to work off customer points (latitudes and longitudes) or polygons (e.g. postcode areas). Then you should decide if you need to set different parameters for each territory. You will need to do this if one of the following applies:
-
You want to override the default colour for a territory shown in the map.
-
You want to optimise territories automatically and want to set different minimum or maximum quantities for different territories.
If you have different parameters for territories, an additional input table in your Excel called “Territories” will be required.
Input data
The Territorium module runs off either one or two input tables in your Excel spreadsheet, (1) the Areas / Customers table and (2) the Territories table.
Areas / customers table
If you’re using Territorium for polygons this table is called Areas, for points its called Customers. In both cases it represents your input data to be assigned to territories. It has the following fields:
-
id. A unique id for each customer or the postcodes/zipcodes for the polygons.
-
latitude. [Points mode only] Customer latitude.
-
longitude. [Points mode only] Customer longitude.
-
quantity. Quantity associated with each customer or polygon - for example your estimate of workload.
-
cost-time. When using the optimiser, cost which is applied per unit time between the customer or polygon centre and its territory centre.
-
cost-distance. When using the optimiser, cost which is applied per unit distance between the customer or polygon centre and its territory centre.
-
territory-id. Id of the territory (from the Territories table) which gets filled in by the optimiser when you run it and which is used to colour the map. By default a random colour is chosen based on the territory id.
Territories table
The Territories table has settings for your input territories. Typically each record would refer to a salesperson or technician who will be assigned a geographic area to work in. The territories table has the following fields.
-
id. Choose a unique identifier for each input territory record (e.g. ‘John’, ‘Paul’, ‘George’, ‘Ringo’).
-
min-quantity. When using the optimiser, the minimum quantity which should be assigned to that territory, typically a measure of workload or potential sales.
-
max-quantity. When using the optimiser, the maximum quantity which should be assigned to that territory.
-
Target location fields. When using the optimiser you may want to optimise with territory centres already being fixed (for example to your agents’ homes or depot locations) and just assign polygons/customers to territories based on these existing locations. Alternatively you may already have existing centres for territories and you are willing to move them a small amount to make them more efficient, but changing territories is disruptive so you don’t want to move the centres too much. In these scenarios you want to define a target location and either (a) fix the territory centre to the target location or (b) penalise the travel cost between the central customer in the territory and your target. The following fields control this behaviour:
-
fix-to-target. Fix the centre of the territory used for cost calculations to the target centre instead of the most central customer. This has the effect of locking the territory into place. Set this to 1 for fixed target and 0 for no fixed target. Alternatively if you enter true, vrai, false or faux it will be automatically converted into 1 or 0.
-
target-latitude. The latitude of the target location, or empty if not set.
-
target-longitude. The longitude of the target location, or empty if not set.
-
target-cost-distance. A cost which is applied per unit distance between the territory centre (most central customer or polygon) and the target location. This is used to keep a territory near to an existing location but allow some flexibility. The cost is not used if fix-to-target is true (as it becomes irrelevant).
-
target-cost-time. A cost which is applied per unit time between the territory centre and the target location.
-
-
display-colour. Colour to use for the territory in the map. If left blank, a random colour is chosen based on the territory id. You can enter hexadecimal colours into this field, for example #ff0000 for red, #00ff00 for green and #0000ff for blue. See http://www.color-hex.com for example colours. Basic English name colours (e.g. red, black) will automatically be translated into hexadecimal colours.
Using Territorium with polygons
To use Territorium with polygons, you should first setup the script and then setup your data.
Setup script using a shapefile
Before creating the script, ensure you don’t have an Excel open in ODL Studio. If you have one open, close it first using the File, Close menu option. If you have an existing Excel open when you create the Territorium script, ODL Studio may try to automatically link the script inputs to whatever tables are present.
Use the wand icon in the toolbar below the tables panel (on the left) to select the “Territorium” component. Select the option to use Territorium with polygons and a file browser will then appear where you need to select your shapefile. The shapefile should contain the polygons you want to use to define territories - e.g. zips, postcodes etc.
The shapefile location can be anywhere on your system, however ODL Studio has a special directory within its install directory for shapefiles. This is the data\shapefiles subdirectory within your install directory. If place your shapefile within this directory and select this shapefile in the wizard, the shapefile will be treated as a relative shapefile and only the location of the file relative to the data\shapefiles will be saved in the Territorium script. This makes your ODL Studio configuration portable - you can simply copy the ODL Studio install directory and subdirectories (containing the shapefile), together with your Territorium script, over to another computer and it will still work correctly, because the shapefile location is relative.
If your shapefile is large - e.g. over 25 MB - you are advised to convert it to an .odlrg (ODL render geometry) file first. Convert the .shp file using the shapefile exporter component in ODL Studio. Launch the shapefile exporter wizard using the wand icon. You should then select the .odlrg file instead of the .shp file in this wizard. .odlrg files draw a lot quicker and use less memory than .shp files. This is important - if you tried to use a shapefile for all zips in the USA without first converting to a .odlrg file, ODL Studio will probably run out of memory and freeze.
After selecting the shapefile you should then select the fieldname in the shapefile which contains the zip or postcode. Next, script editor window appears for the newly-created Territorium script. Save this script using the Save As button on the bottom right of the script editor window. Save it to your current scripts directory (shown on the left-hand side of ODL Studio). After saving, the options for your Territorium script will appear in the current scripts directory window and you will be able to run these options by simply left-clicking on the icon.
Setup your own data
To view your existing territories or create new ones you should:
-
Acquire a shapefile containing the polygons for whatever type of building block you’re using - e.g. zip, postcode etc.
-
Create the Territorium script for polygons as described in the previous section, using this shapefile. Don’t forget to convert the shapefile to an .odlrg file if its large.
-
Create a new Excel in ODL Studio using the menu option File, New and then selecting Create empty datastore.
-
Run the Territorium script option create input tables. The script option can be run by left-clicking on their icon. After running you should have have an Excel with an empty Areas table.
-
Run the Territorium script option Add missing areas to table, remove invalid ones. After running the Areas table in your Excel should be filled with all the postcode or zipcode names but a blank territory-id field. The quantities field will be automatically filled with 1.
-
Replace the data in the Areas table with your own data.
-
Delete any rows from the Areas table for zipcodes / postcodes you’re not using. For example if you’re doing a territory allocation within London UK you won’t need postcodes outside of London. If you’re using USA zipcodes and you’re only working on a small area (e.g. a couple of states), this will speed things up considerably. (Note for USA zipcodes you should always build and use the .odlrg file as described in the previous section).
-
Fill in your own territory names into the territory-id field of the Areas table. Ensure you always use the exact same spelling for a territory name. If you don’t have territories yet just leave this field blank - you can manually paint the territories or automatically assign them as explained below.
-
If you have a quantity field to use - for example sales or workload - fill this into the quantity field so you can use the heatmap etc.
-
-
Launch the Show territories map script option (by left clicking on its icon) to view your territories map and start painting territories. See later section for more details.
-
Launch the Show territory quantities report to see the sum of quantity for each territory.
Remember you can always save the Excel spreadsheet and then open the data within Excel itself to manipulate it.
Available script options using polygons
Your Territorium script for polygons will have the following options available:
-
Create input table(s). Create the input tables (initially empty) in your spreadsheet.
-
Add missing areas to table, remove invalid ones. Any polygons which exist in your shapefile but are not found in your Areas table will be added to the Areas table. The postcode or zipcode will be used as the Id field in the Areas table (providing you selected the correct field previously). Any rows in your Areas table with Ids not found in the shapefile will be deleted. Use this option to initially fill your Areas table based on a shapefile.
-
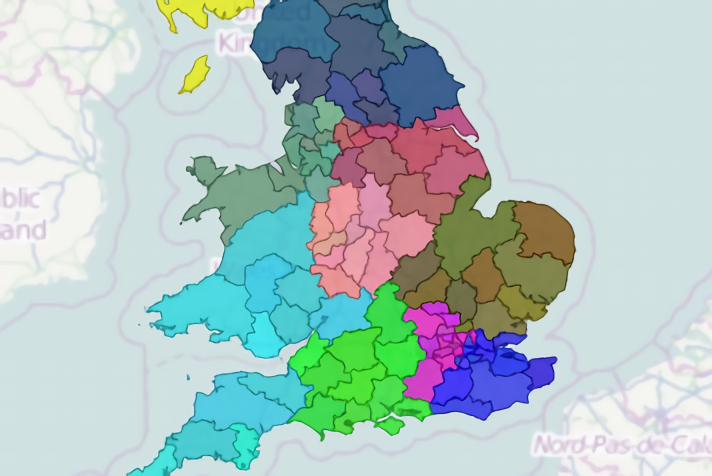
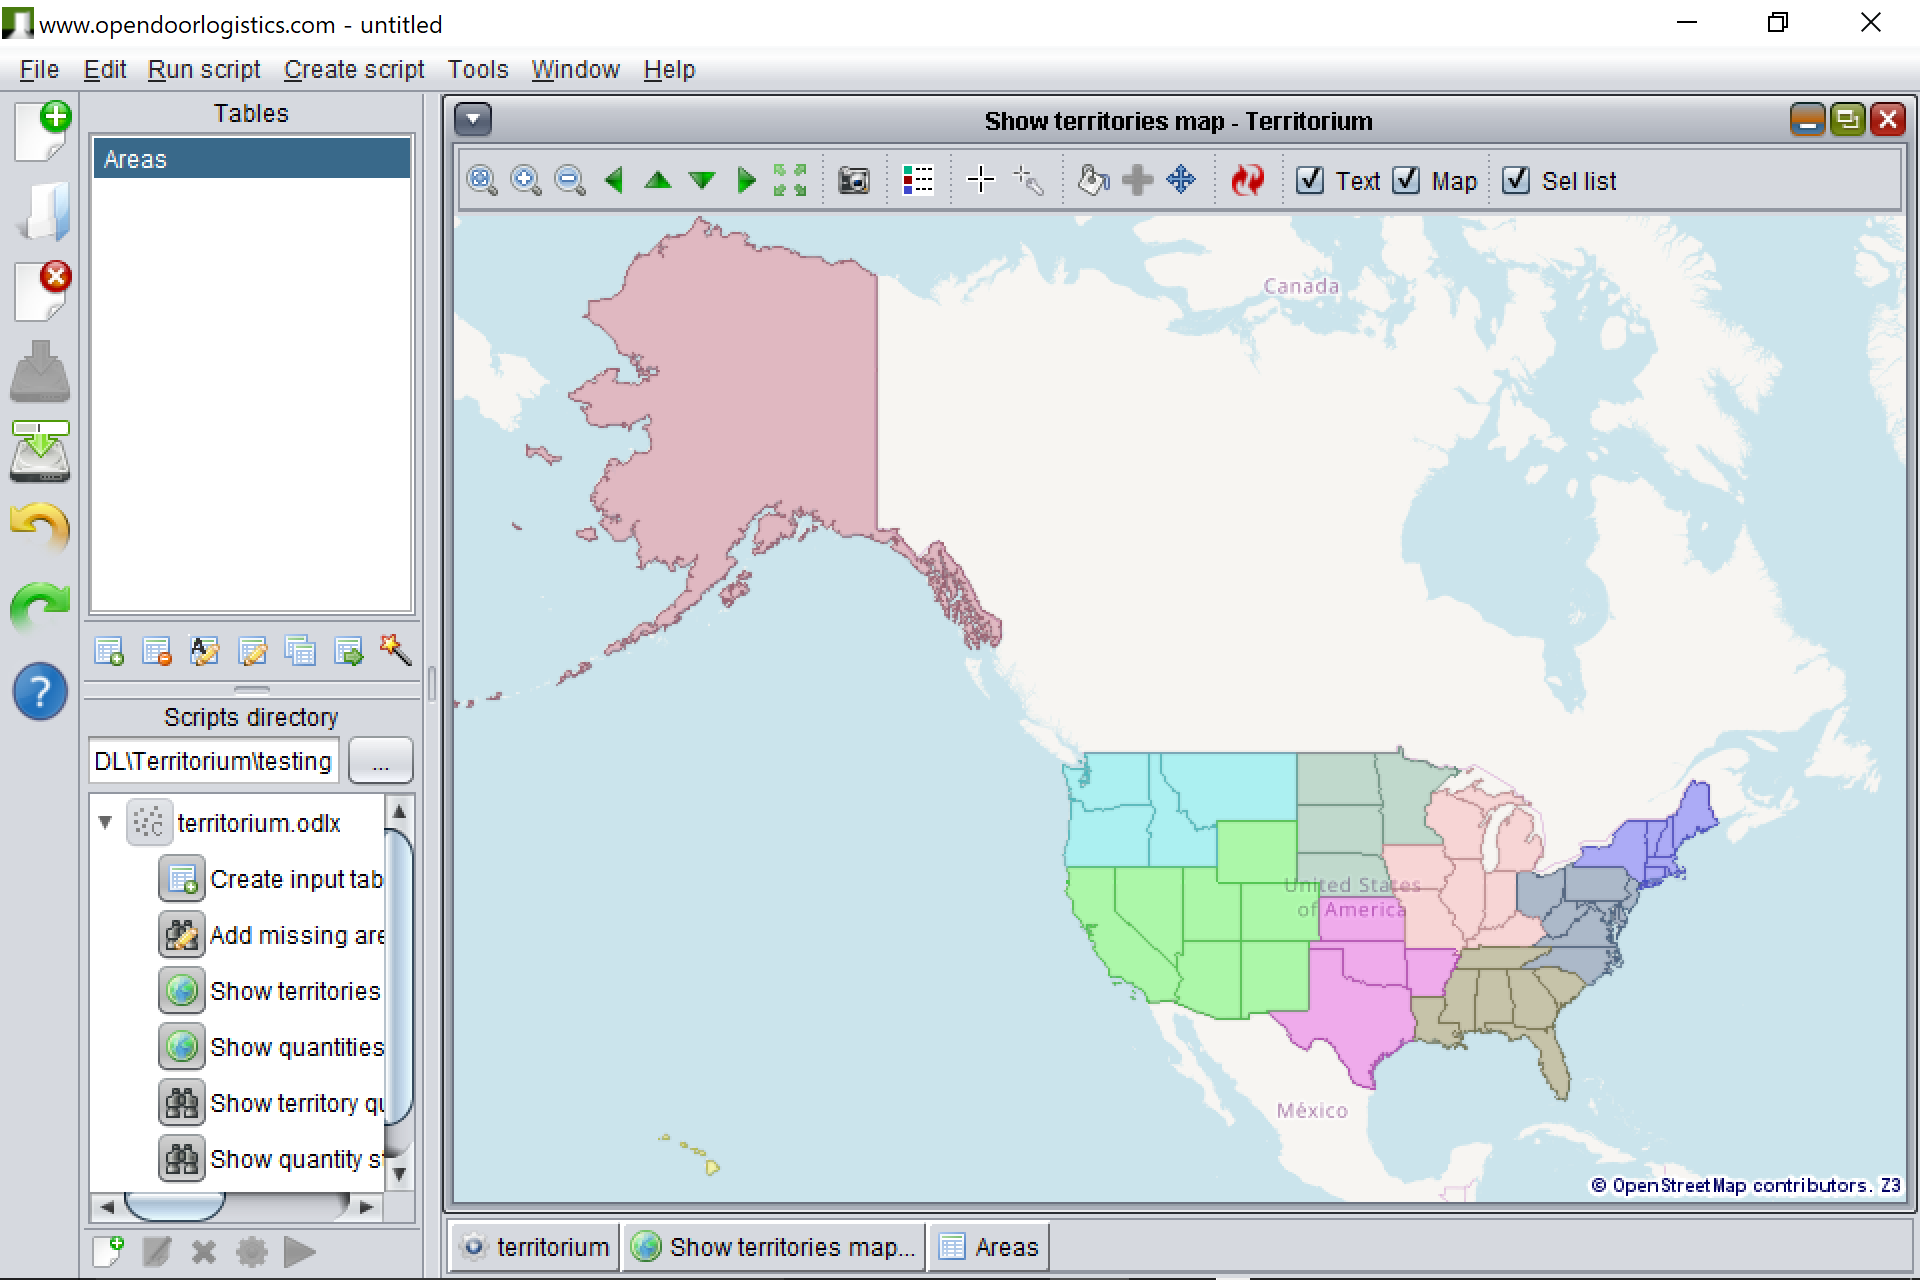
Show territories map. Show a map with your polygons coloured by their assigned territory (from their territory-id field). Use this map to manually paint your territories (see later section describing this function). See separate ODL Studio documentation on using the map.
-
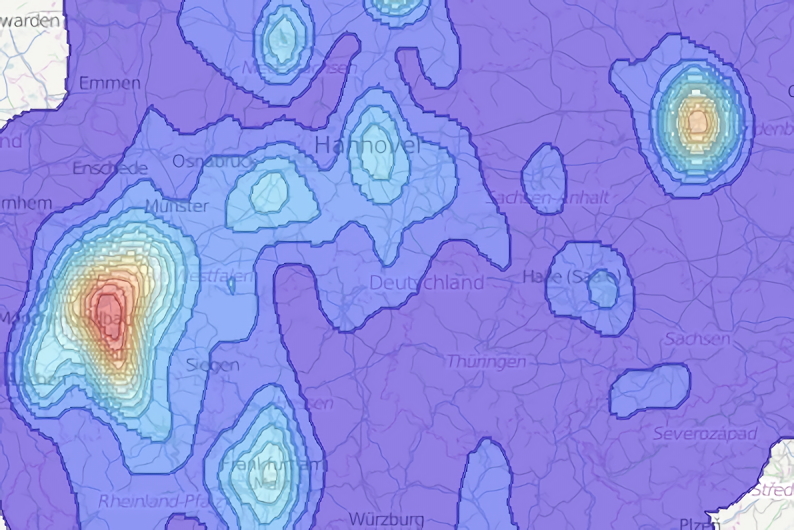
Show quantities heatmap. Show a heatmap for your territories coloured according to the quantity field. The legend tool is very useful, it can be opened by clicking on the icon at the top of the map. The legend displays the colours used for 10 different bins from 0 to your maximum quantity.
-
Show territory quantities report. Shows the sum of quantity for each territory.
-
Show quantity statistics. Shows statistics on your quantity values (e.g. min, max, sum).
-
Optimiser. See later section for optimiser options.
Using Territorium with points
If you’re using Territorium for points, the module works off the Customers table containing latitude and longitudes for each customer.
Setting up
-
Ensure you don’t have an Excel open in ODL Studio. If you have one open, close it first using the File, Close menu option. If you have an existing Excel open when you create the Territorium script, ODL Studio may try to automatically link the script inputs to whatever tables are present.
-
Create the Territorium script for points. When you save the script to your current scripts directory, it should appear in the panel on the bottom left of ODL Studio, with various options.
-
Create a new Excel in ODL Studio using the menu option File, New and then selecting Create empty datastore.
-
Run the Territorium script option create input tables. The script option can be run by left-clicking on their icon. After running you should have have an Excel with an empty Customers table.
-
Run the Territorium script option Fill input tables with demo data. You can select demo data from several countries (note for some countries the available data has some issues and may include a few addresses from other countries too). Your customers table should now be filled with example customer data - ids, latitudes and longitudes, quantities etc.
-
Run the Territorium script option Show territories map to see the example data.
-
Delete the example customers data and replace with your own, using the same data format. Customer ids should be unique.
-
Fill in your own territory names into the territory-id field of the Customers table. Ensure you always use the exact same spelling for a territory name. If you don’t have territories yet just leave this field blank - you can manually paint the territories or automatically assign them as explained below.
-
If you have a quantity field to use - for example sales or workload - fill this into the quantity field so you can use the reports on quantity per territory.
Remember you can always save the Excel spreadsheet and then open the data within Excel itself to manipulate it.
Available script options using points
The following options are available:
-
Create input table(s). Create the input tables (initially empty) in your spreadsheet.
-
Fill input tables with demo data. Create demo data for different countries.
-
Show territories map. Show a map with your customers coloured by their assigned territory (from their territory-id field). Use this map to manually paint your territories (see later section for description).
-
Show territory quantities report. Shows the sum of quantity for each territory.
-
Show quantity statistics. Shows statistics on your quantity values.
-
Optimiser. See later section for optimiser options.
Manually painting territories (polygons or points)
Open the show territories map option, to show the customers or polygons coloured by their territory-id field. If you press the fill icon (the paint bucket icon in the toolbar at the top of the map) you can manually adjust the territory. Press the icon to go into fill mode. In the panel which appears on the left, select territory-id as the field to fill. Then type in the new id for a territory under “Set fill value”. Left click and drag across the map to paint your territories. Remember you can always undo and redo any changes to the territories using the undo and redo buttons on the left-hand side of ODL Studio.
The map - and any reports you have open - will automatically update when you make manual adjustments to territories. You can also make manual adjustments by double-clicking on the Areas / Customers table in the top-left tables panel, and then filling in the territory-id field as desired. Again the map and any open reports will automatically update.
The legend can be opened by clicking on the icon at the top of the map (the white box containing a vertical line of coloured boxes). The legend lets you select individual territories, zoom on them and show / hide them. You can also use it to search for unassigned customers or polygons.
Using the optimiser (polygons or points)
This section describes using the optimiser in points mode, simply follow the same methodology to use the optimiser for polygons instead.
When the optimiser runs using polygons, it takes the centre of each polygon and treats it as a ‘customer point’, so the optimiser model is essentially the same for both customers and polygons. The following sections on the optimiser assume you’re using points, but are equally applicable to polygons.
First create a points-mode Territorium script, use the option to create the input tables and then use the option to create demo points data. Remember you can run an option just by left-clicking the icon shown in the scripts directory panel on the left of ODL Studio.
After creating the demo points data, open up the options (by clicking on the arrow) inside Optimise. The first two options are Start optimisation and Continue optimisation. Click Start optimisation and you will see a progress bar appear for a few seconds while the optimiser runs. If you double left-click on the Customers table name in the tables panel, you can see that the optimiser has now filled in the territory-id field for each customer record. In the next sections we discuss the optimiser in detail and then inspect the results of running the optimiser.
Understanding the cost model
It is important to understand the model behind the optimiser. The optimiser minimises the total cost - also known as the objective function. The customers cost for a territory is the sum of transport costs from each customer to the territory centre. The transport cost for a customer is:
cost_time x time_to_territory_centre + cost_distance x distance_to_customer_centre
The territory centre is either:
- The customer location within the territory which minimises the total territory customer cost (i.e. most central customer if the cost-time and cost-distance fields are the same for each customer)
OR
- The target location, if this is fixed.
If a target location is set, but not fixed, then a further cost - the target-cost - is added to the customer cost for a territory. For a territory the target cost is:
target_cost_time x time_from_territory_centre_to_target
+ target_cost_distance x distance_from_territory_centre_to_target
The optimiser also minimises the quantity violation - the quantity outside of the accepted quantity range (min and max quantity) for each territory. For a territory, the quantity violation is defined as:
max( 0 , quantity - max_quantity) + max(0, min_quantity - quantity)
The objective function for the whole optimiser actually minimises the quantity violation first, then minimises the cost (technically this is called lexicographic ordering).
Optimiser configuration
Various options are available within the optimiser configuration. Double-click on the name of the script (usually “Territorium”) in the scripts panel, or right click on it and select “Edit.” This opens up the script editor window. Left click on “Optimiser settings” in the left of the script editor window, and the available optimiser settings should appear, as shown in the figure.
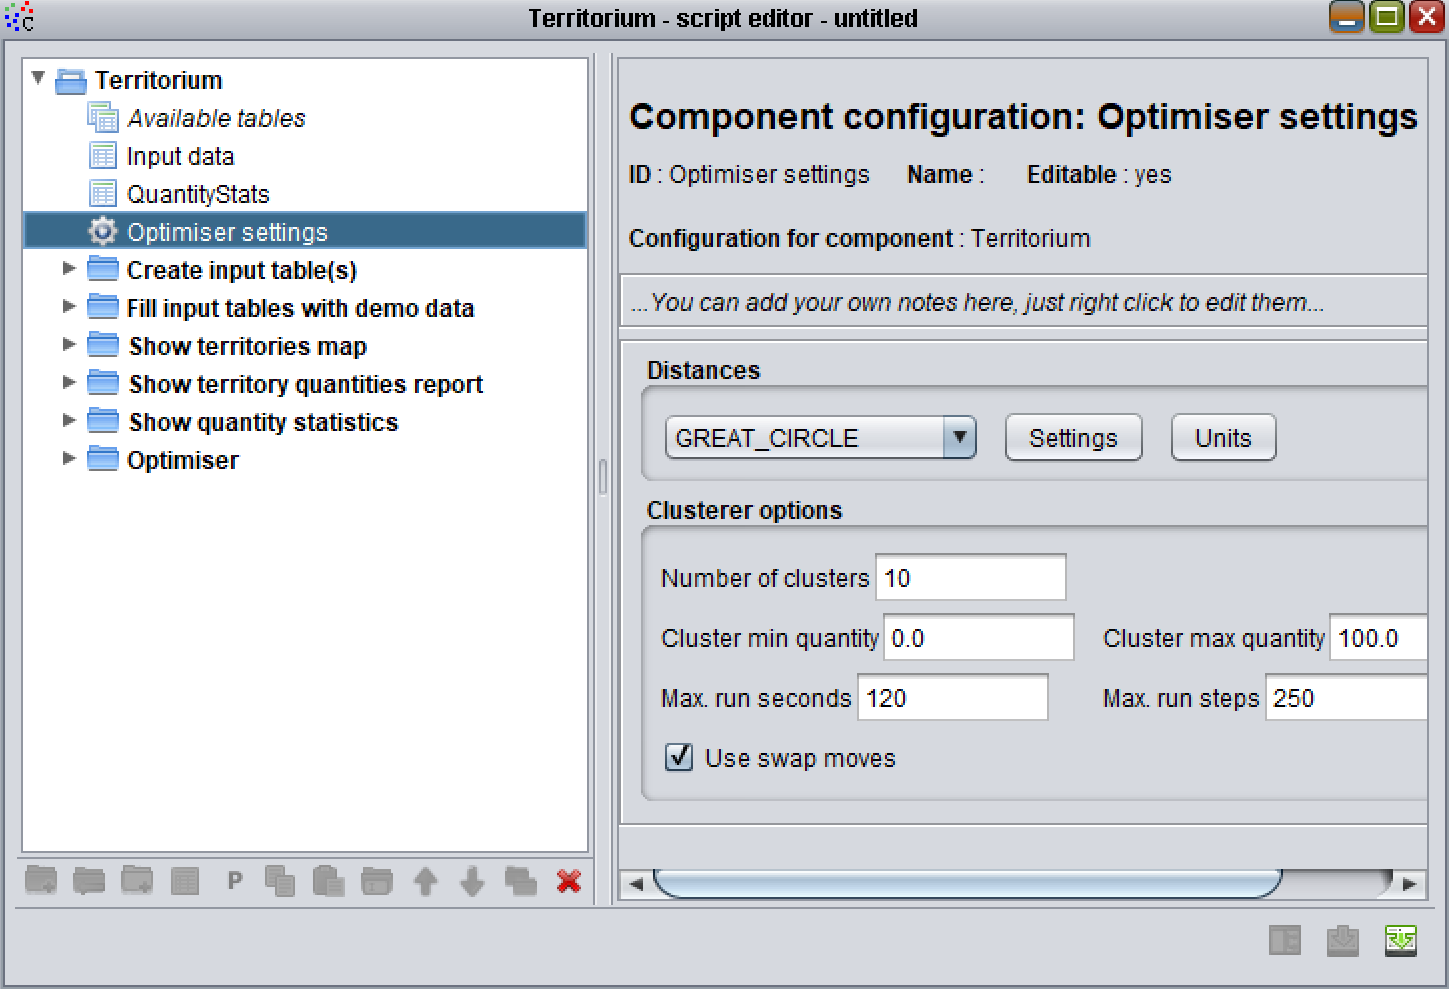
In the distances panel you can set the distances units and calculation method. The units are the ones used throughout Territorium, so if you set the time units to hours (the default) then the “target-cost-time” and “cost-time” fields are costs per hour. Similarly if you choose km for distances, the cost per unit distance fields are in km. The default distance calculation method is “Great circle” - which basically means a straight line (along the Earth) between two points. Typically you would want to change this to “Road network” and build a road network graph for your country, following the tutorial on our website.
If you want to run the optimiser for longer increase the “max run seconds” and “max run steps”. You may want to set these to very large numbers - e.g. 9999999 - and just stop the optimiser using the “Stop early” button when you want to view the results. You can always continue the optimisation again from the current solution using the “Continue optimisation” option. So if, for example, you have a very large problem and you’ve been leaving it to optimise for 20 minutes, you can stop the optimisation using “Stop early”, view the results and then restart using “Continue optimisation” without going back to the beginning of the optimisation (i.e. no optimisation time lost).
You are advised to keep the “Use swap moves” option turned on; generally you will get better solutions using this method although the optimiser may take longer to run.
Inspecting the result - reports
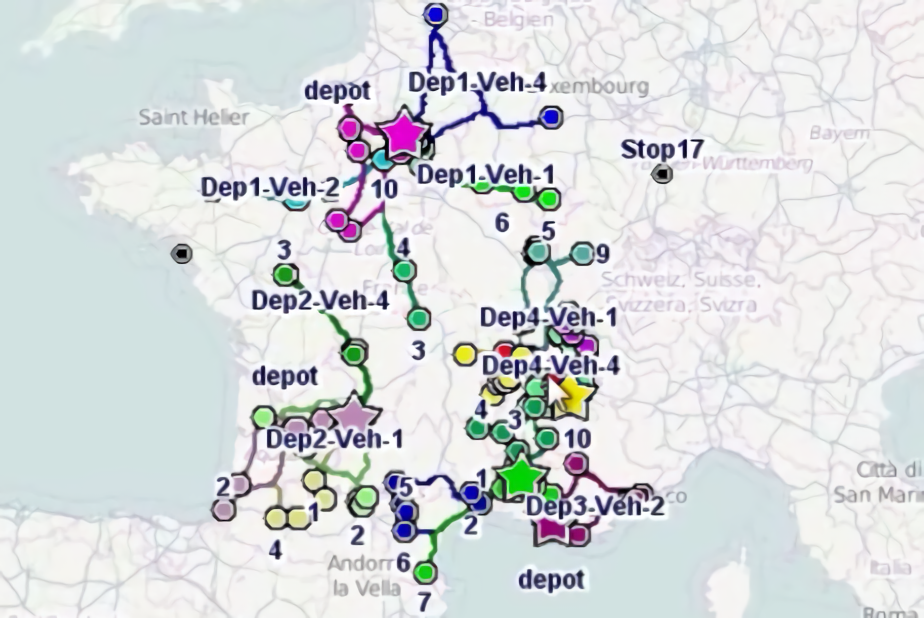
After the optimiser runs the territories map will be automatically updated if its open. Under the option “Optimiser, Analyse results” option we also have a different map available which shows the territory centres as well, as calculated by the optimiser. If run the option Optimiser, Analyse results, Show map with centres (left-click on the icon in the scripts panel) you should see a map appear with coloured points for the country you selected in the demo data creator and stars for the territory centres. The points and stars are coloured by their assigned “territory-id”. In the following figure we have a map for customer assignment into sales territories for Australia.
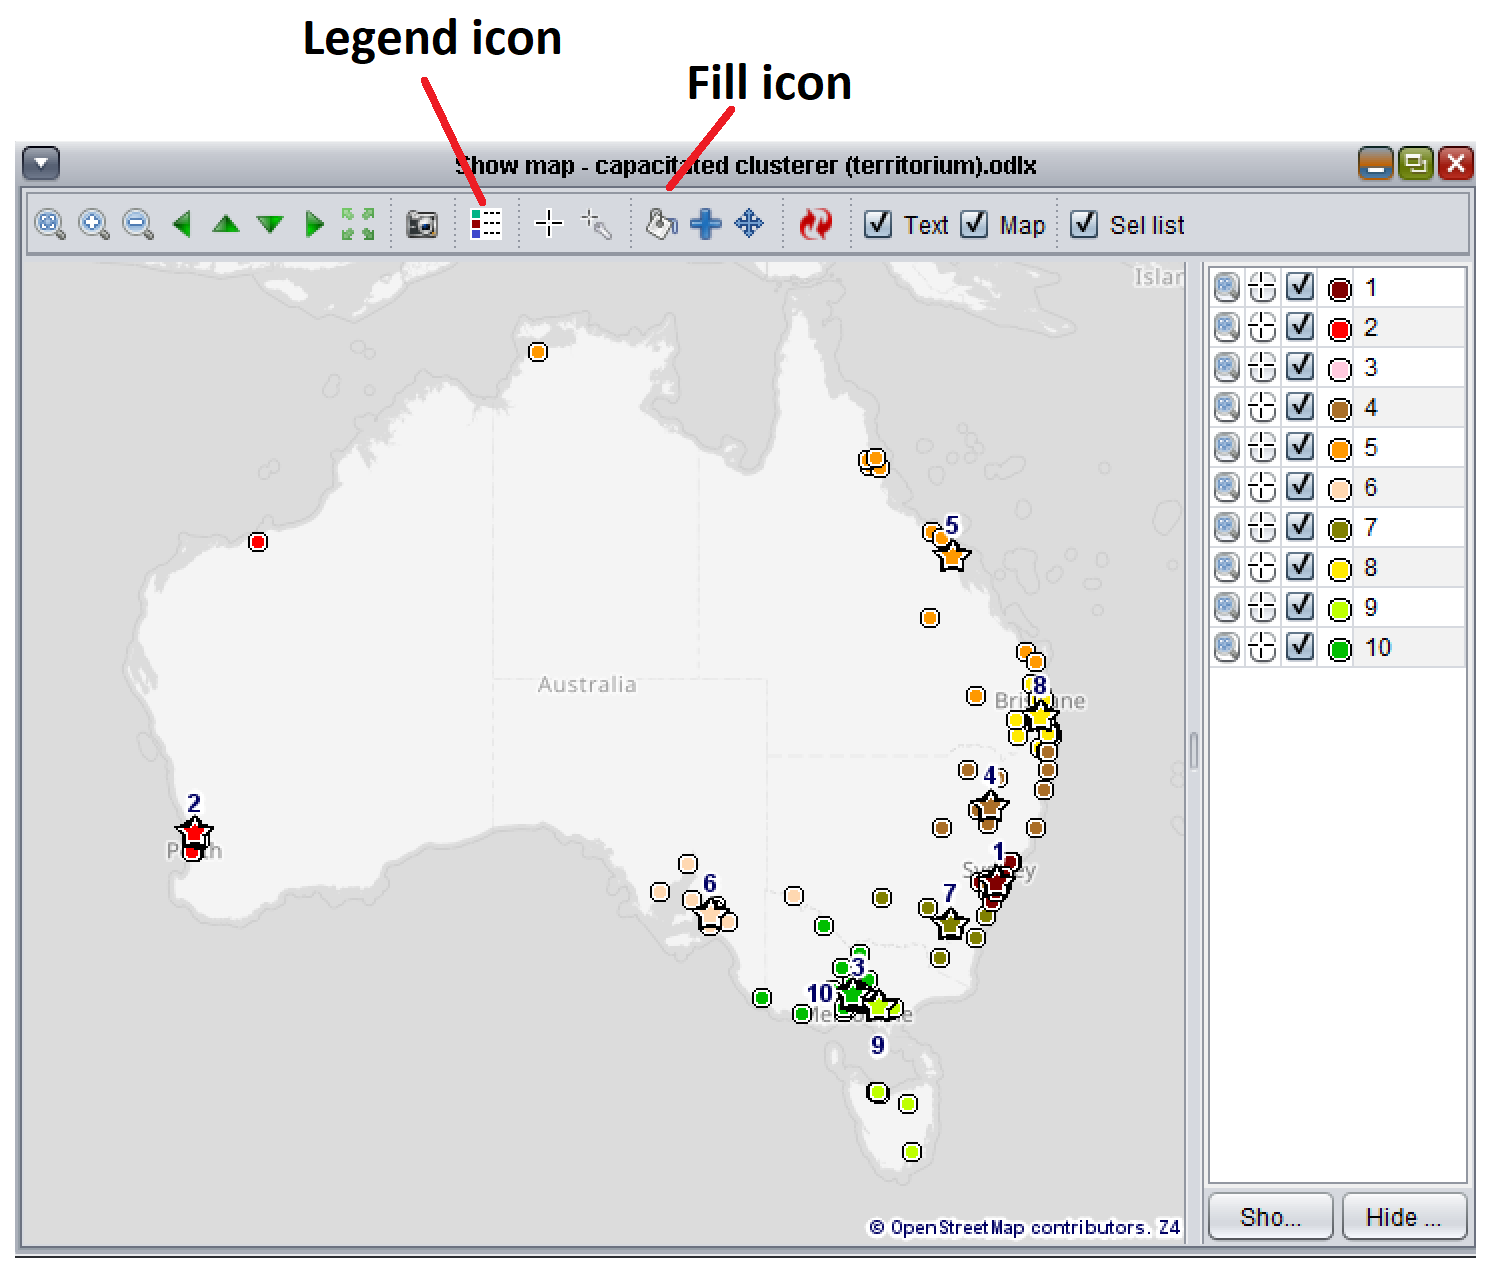
Click on the legend icon at the top of the map control (white box with coloured squares - see the figure). The legend control on the right of the map lets you zoom on, select and show / hide customer points for each territory. See our tutorials on using the map within ODL Studio for more details on the map control. If you press the fill icon (the paint bucket - see the figure) you can also manually adjust the territory (see previous section).
Three different reports are also available under the “Optimiser, Analyse results” option:
-
Show customers report. For each customer (or area), this shows the travel time, distance and cost between the customer (or area centre) and its territory’s centre. It also shows the percentage of total territory quantity coming from the customer.
-
Show territories report. For each territory, this shows the number of customers (or areas), the total quantity, the total quantity violation (any violation - above the max or below the min - is shown as positive) and the latitude and longitude of the territory centre. It also shows the total cost for the territory, the totals of customer travel time, distance and cost, and the target location travel time, distance and cost (if set).
-
Show solution report. This shows the number of territories which were used and the number of assigned and unassigned customers. The optimiser will always assign all customers (providing you give it input territories), however when you manually edit the data you could leave the “territory-id” field for a customer blank, making it unassigned. We also show the total assigned quantity and quantity violation and the breakdowns of the various travel times, costs and distances.
If you want to save these report tables, click the icon for “Export report tables to spreadsheet” and the tables will be copied into the spreadsheet. Note the tables will not be automatically updated when they are saved in the spreadsheet, only the tables shown in the report controls are automatically updated when the data changes.
Tip - if you setup your data correctly you can use these reports with your existing territory ids, without even running the optimiser.
Advanced modelling strategies
You can use the min and max quantity fields to keep the quantity for each territory within your desired range. If this isn’t possible with your data - for example you have a customer whose quantity exceeds the maximum quantity per territory - the optimiser will do the best job possible to reduce this quantity violation. If you use a measure of work for the quantity, you can use this to ensure each territory has a minimum as well as maximum amount of work.
If you have customers that you visit frequently and customers that you seldom visit, you may want to set the cost-time or cost-distance for the frequently visited customers to be higher. This will favour territories centred on the customers you visit the most.
You can also - with some data manipulation - use Territorium for defining hierarchical territories (i.e. territories within territories - for example local sales people who are assigned to regional managers). The approach is suboptimal (i.e. may not get the absolute best solution) as we split it up into two separate problems, but is probably good enough for most circumstances. First you would create base level territories as discussed above. You would then use the territories report to get the latitude and longitude of each of these “Level 0” territories. Now create a new spreadsheet with empty Customers and Territories tables. For each of your “Level 0” territories, take the latitude and longitude and add a ‘dummy’ “Level 1” customer using the “Level 0” cluster latitude and longitude - so the “Level 0” territories become the “Level 1” customers. Next create records in the Territories table for your “Level 1” territories, for example your regional sales managers (if optimising sales territories) or depots (if optimising technician work areas, where several technicians share a depot). Now fill in the quantities as desired and optimise to assign your “Level 0” territories to “Level 1” territories.