Predictive route optimisation for on-demand deliveries
Posted 20 May 2018
On-demand deliveries of hot food from restaurants is a fast-growing industry, with the global market dominated by giants such as Deliveroo, DoorDash, Grubhub, Menulog, Postmates and Uber Eats. From discussions with various companies in this area, we’ve found that delivery planning and dispatching is either (a) a manual process or (b) automated but using simple and underpowered algorithms. In this post, we benchmark full AI-based delivery dispatching, powered by sophisticated realtime route optimisation algorithms and machine learning. For realistic hot food delivery scenarios, we find a 28% reduction in delivery times, compared to the simpler dispatching algorithms in common use. As a result, we recommend that all organisations making on-demand deliveries integrate these steps into their dispatching process.
Five steps to effective delivery dispatching
We start with the most basic dispatching algorithms and demonstrate the gains possible by incrementally applying multiple ‘next level’ optimisation techniques and dispatching strategies. We group these strategies into five steps as follows:
-
Automated dispatch. The most basic level, where a new order is sent to a driver as soon as it’s placed by the customer and a driver can only serve one order at a time (i.e. only one order on-board at once). So, a driver does pickup1, deliver1, pickup2, deliver2, etc.
-
Stacked orders. Orders are still sent to a driver as soon as they’re booked by the customer, but we let the driver hold multiple orders on-board their vehicle at once. For example, a driver can do pickup1, pickup2, deliver2, deliver1. Stacking orders increases the effective capacity of the fleet, as each driver can do more.
-
Delayed dispatch. Instead of sending orders to drivers straightaway, orders are dispatched a few minutes before the driver needs to start serving them (i.e. start driving to the restaurant for order pickup). A buffer of pre-dispatched orders is therefore held by the system, allowing the optimiser to explore many permutations of possible orders on different routes before finally dispatching an order to its assigned driver. With more possible combinations the optimiser can plan more efficient routes.
-
Predictive routing. A prediction model is constructed based on typical ordering patterns from historical data (e.g. orders for the last week or month). This model is integrated directly into the routing algorithm. Routes and dispatches are planned based around both (a) known orders and (b) estimated future ordering patterns.
-
Predictive driver repositioning. The prediction model is extended to support repositioning – when drivers are waiting for work, the optimiser suggests they drive to different locations where work is likely to appear in the near future. The idea is that by placing the right number of available drivers in the right locations, future orders can be delivered more quickly.
How to evaluate realtime dispatching strategies?
ODL Live is a webservice API for realtime route optimisation, with proprietary algorithms for predictive dispatch and repositioning, and can optimise with all five of our steps. To test the efficiencies gained from introducing each step in-turn, we use our offline ODL Live simulator tool. Realtime route optimisation problems can only be modelled offline using a simulator. This kind of modelling is used for ‘what-if’ scenarios - e.g. ‘could I still deliver last week’s orders on-time with a smaller delivery fleet?’. A simulator wraps around the optimiser engine and simulates the evolution of the planning over the entire delivery period. At the start, only a few orders are known and the simulator plans just these, whilst separately simulating the vehicles as ‘agents’ which depart for stops, arrive and complete them. As more orders are placed, the simulator re-plans taking into account the current positions of the simulated vehicles, on-board deliveries and those already completed. Within the simulation, the delivery plan evolves continually over the course of the delivery period, as the situation changes.
Takeaway delivery scenarios explored
We generate many artificial delivery scenarios, based on realistic assumptions for order creation time, stop time, road network travel times and other key statistics. Each scenario is based in the same area of Paris but with different clusters of randomly-generated restaurants and different randomised delivery orders. We assume 15 drivers and 50 orders placed per hour. The optimisation goal is to deliver orders as fast as possible. To keep things simple, we assume orders are ready to collect from the restaurant as soon as they’re created (i.e. closer to McDonald’s than fine dining). When order stacking is allowed, a driver can hold up to 3 different orders on-board at once.
We assume each driver accepts every order sent to them, corresponding to either (a) an employed workforce or (b) independent contractors with a high acceptance rate (where rejecting a order is not the norm). For delivery networks with lower acceptance rates, the modelling would be setup differently as you’d iterate through a process of (1) offer job to best driver, (2) tell system if they reject it by prohibiting assignment to them, (3) offer job to next driver system recommends, etc. until you found an acceptance.
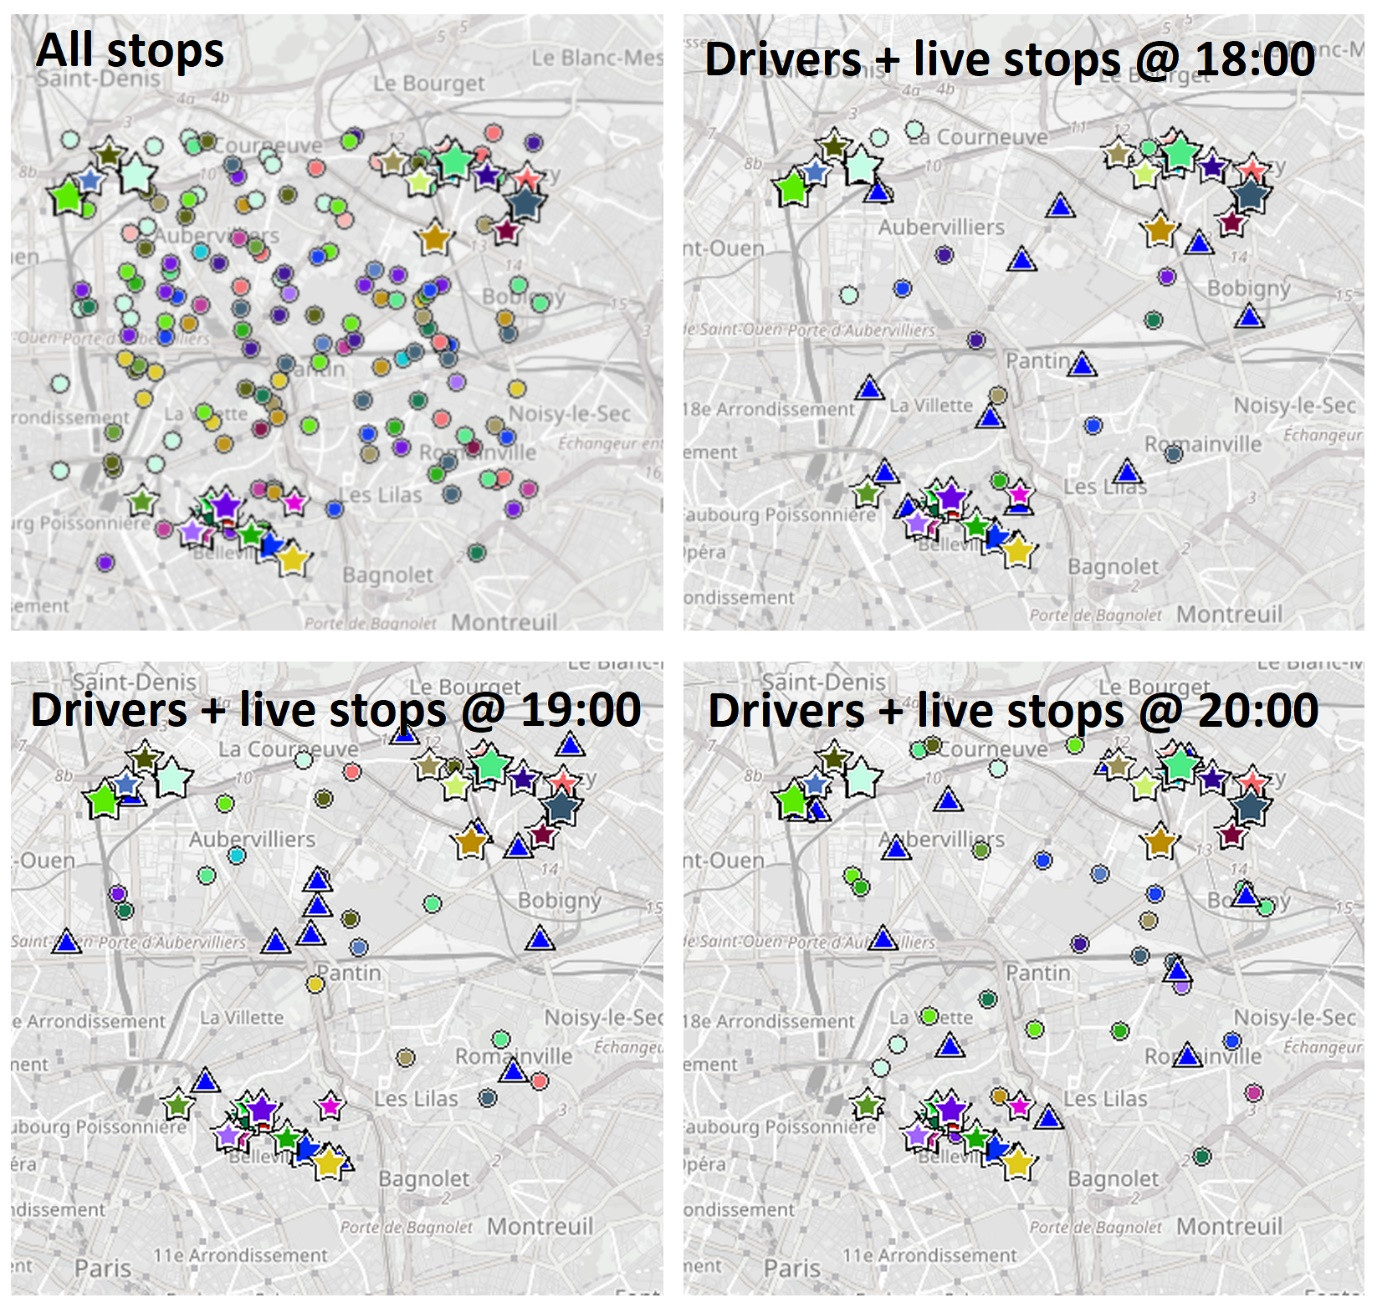
The following grid of four map images shows one of our scenarios. Food orders are collected from restaurants (shown as stars) and delivered to homes (shown as circles). Restaurant stars are sized according to the number of orders the restaurant produces. Delivery locations are shown in the same colour as their corresponding pickup restaurant. Current driver locations, from simulated GPS traces, are shown as blue triangles. The first image shows all orders for the simulated period with all restaurant locations. The other three images show the vehicles and only the live orders (orders which have been placed but not yet delivered), at different times during the simulation. Only a small number of orders are live at any one point in time.
Quantitative results - do we get faster deliveries?
We generate 250 different delivery scenarios, each with a different set of (a) randomly-generated restaurant locations, (b) orders over a three-hour period and (c) artificial order history for previous periods (used to train the prediction model). We simulate each scenario five times over, each time adding an extra step as follows:
- Step 1 - automated dispatch.
- Steps 1-2 - automated dispatch + stacked orders.
- Steps 1-3 - automated dispatch + stacked orders + delayed dispatch.
- Steps 1-4 - automated dispatch + stacked orders + delayed dispatch + predictive routing.
- Steps 1-5 - automated dispatch + stacked orders + delayed dispatch + predictive routing + predictive repositioning.
We define delivery time as the time from order placement to delivery at the customer’s door. Dependent on the chosen locations of the restaurants and orders, some scenarios had quicker delivery times than others, adding ‘noise’ to the statistics. Despite the intrinsic noise, we see a clear pattern when we look at the average delivery time across the five steps, for all 250 scenarios combined:
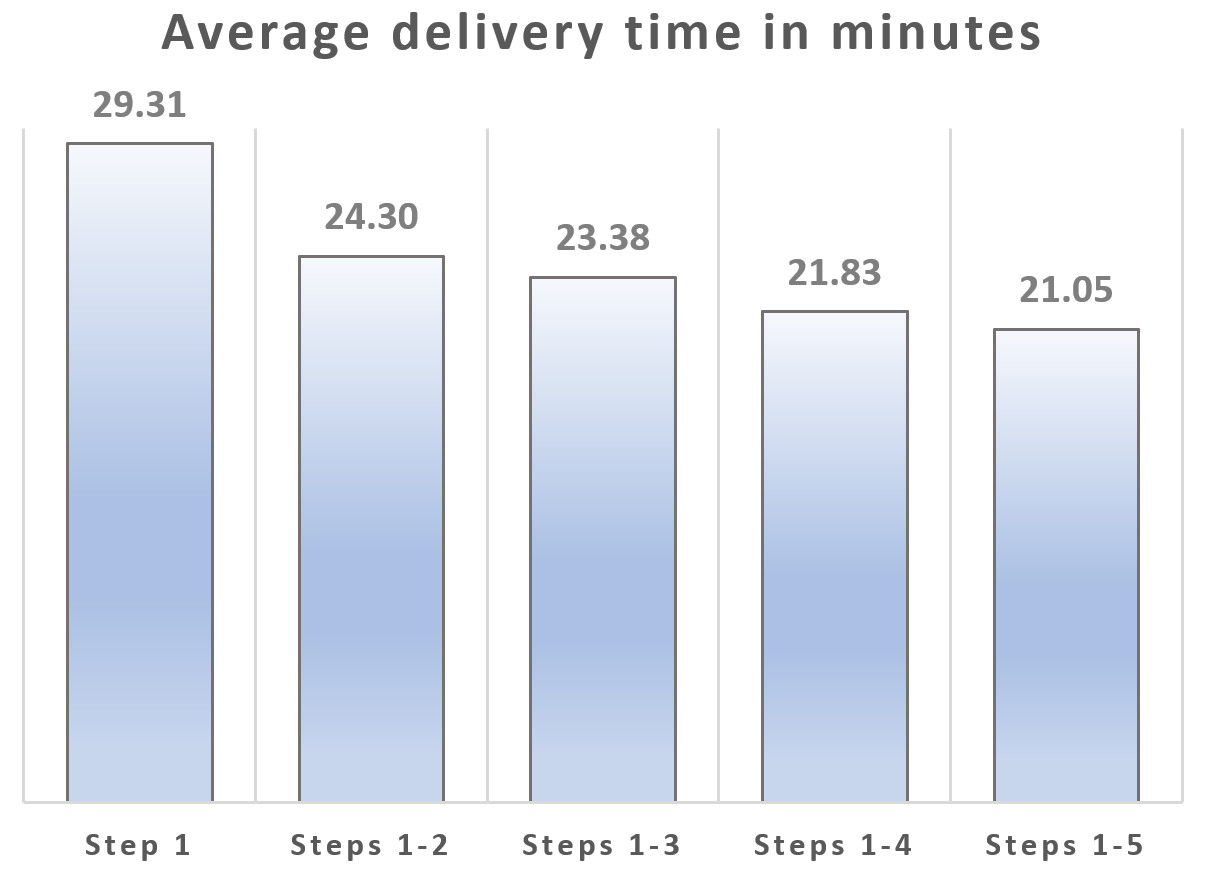
When order stacking is allowed (steps 1-2), we get on-average a five-minute reduction in delivery times. As each subsequent step is added, deliveries are done quicker. Delaying dispatching (steps 1-3) brings average delivery times down by another minute. If we dispatch using the predictive model we save on-average an extra 1.5 minutes, or 2.3 minutes if the drivers also follow the recommendations from the predictive repositioning system. Comparing the most primitive dispatching algorithm (step 1) to the most sophisticated (steps 1-5), we see a 28% reduction in delivery times. On its own, the prediction engine including repositioning creates a 10% reduction in delivery times (steps 1-5 compared to steps 1-3).
We examine these results in more detail. For each additional step, we compare the average delivery time for each scenario before and after adding the step. We then construct histograms based on this data set, as shown below:
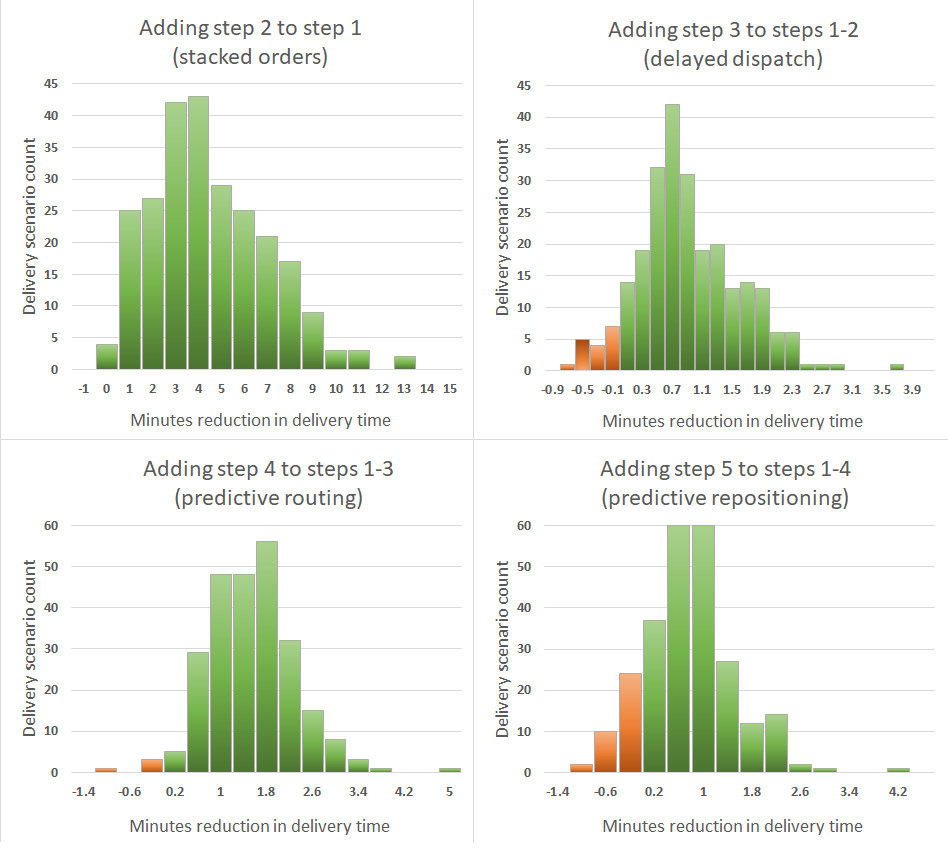
The green bars in the histograms correspond to scenarios where adding the step reduced the average delivery time and the red bars correspond to scenarios where adding the step increased the average time. There’s a lot more green than red, so almost all the time, using an extra step reduces delivery time.
Final thoughts
We’ve shown that for our on-demand prepared food delivery scenarios, each additional step – i.e. modelling technique or dispatch strategy – significantly reduces the average delivery time for orders. The majority of food delivery companies we’ve spoken to use only step 1 or step 2, occasionally step 3. These companies can make potentially large efficiency gains by using the more sophisticated route optimisation techniques discussed here. Given the enormous amount of investment made by venture capitalists into on-demand food startups since 2014, and the losses still being incurred by many of these startups, we advise caution when investing in a company that is not following most or even all of these steps. All five steps should be seen as essential, not optional.
Our scenarios and benchmarking were based on the goal of delivering food as quickly as possible. We have yet to explore the behaviour of the system when configured to prioritise operating costs over speedy delivery, for example by only minimising delivery times that exceed one hour. We plan to do this in a future study.
Please contact us if you’d like more information on ODL Live or are interested in seeing your historic data run through our simulator, to test better dispatching strategies.